Design Characterization for Black-and-White Textures in Visualization
How to aesthetically and effectively use black-and-white textures for categorical data visualization?
Summary: We investigate the use of 2D black-and-white textures for the visualization of categorical data and contribute a summary of texture attributes, and the results of three experiments that elicited design strategies as well as aesthetic and effectiveness measures.
Black-and-white textures are useful, for instance, as a visual channel for categorical data on low-color displays, in 2D/3D print, to achieve the aesthetic of historic visualizations, or to retain the color hue channel for other visual mappings.
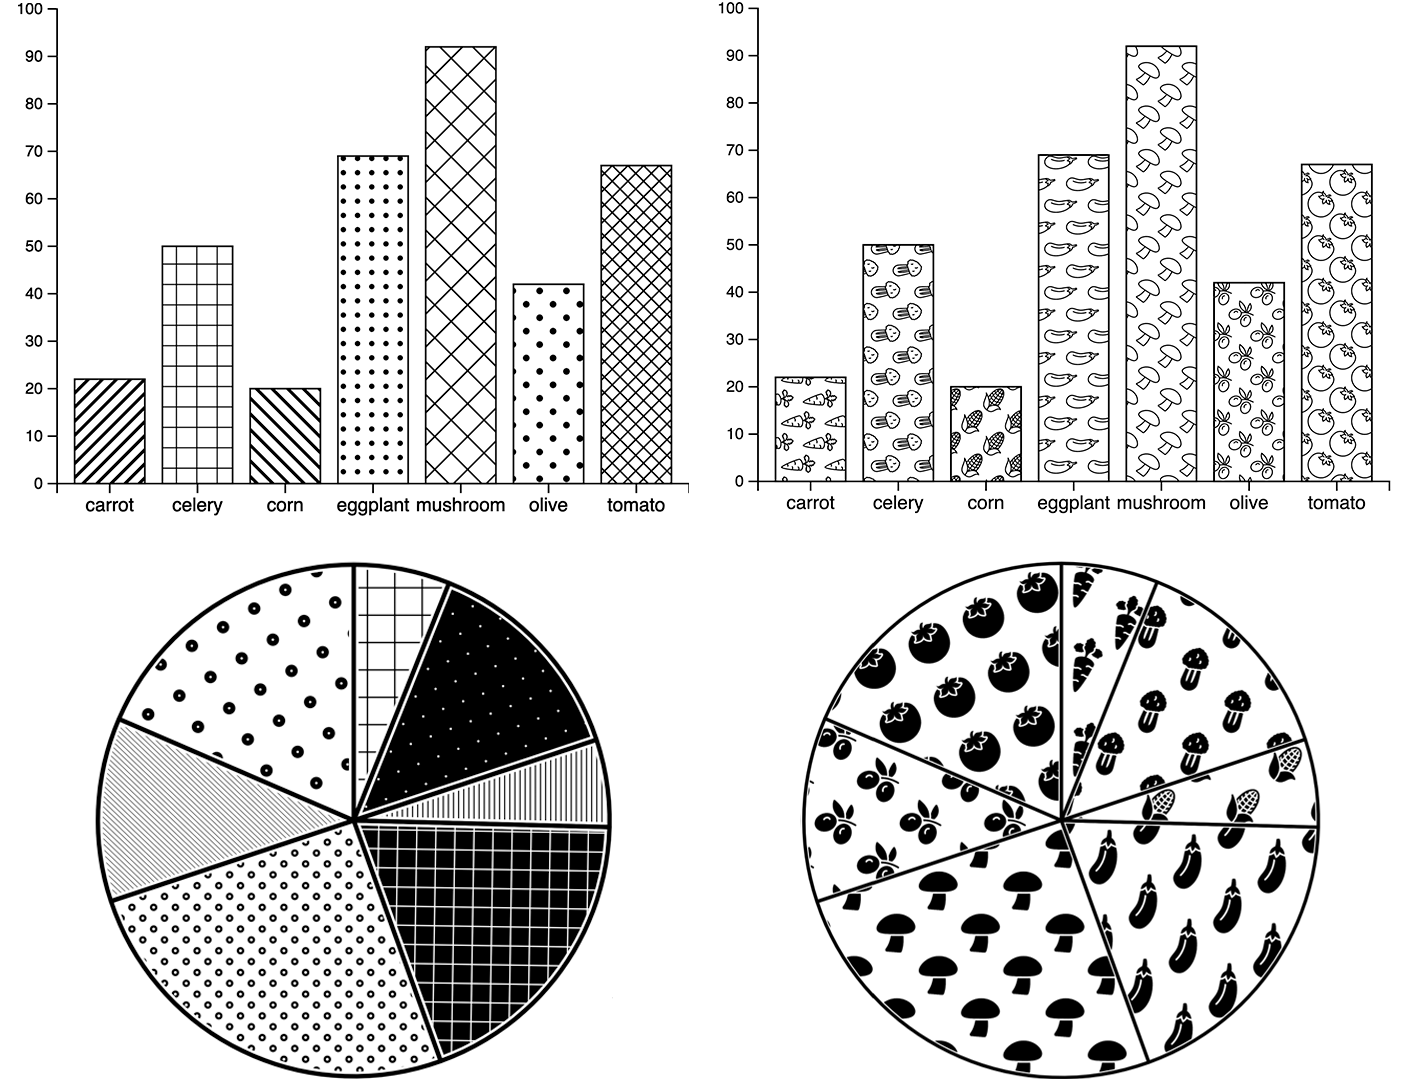
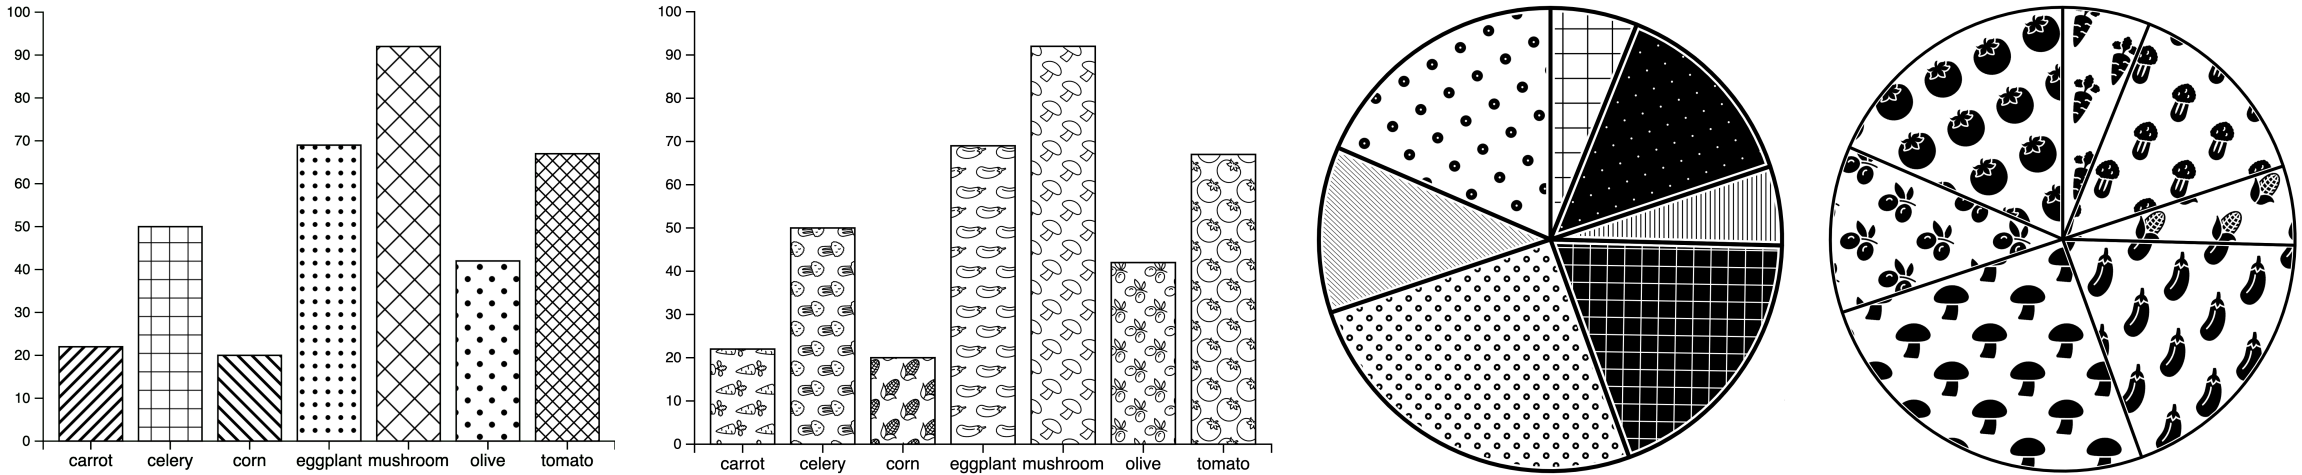
We specifically study how to use what we call geometric textures 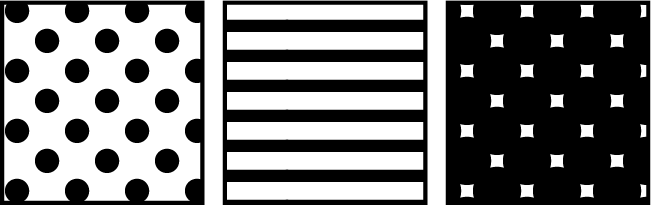 and iconic textures
  . Geometric textures use patterns of repeated abstract geometric shapes, while iconic textures use repeated icons that may stand for data categories.
We parameterized both types of textures and developed a tool for designers to create textures on simple charts by adjusting texture parameters. 30 visualization experts used our tool and designed 66 textured bar charts, pie charts, and maps.
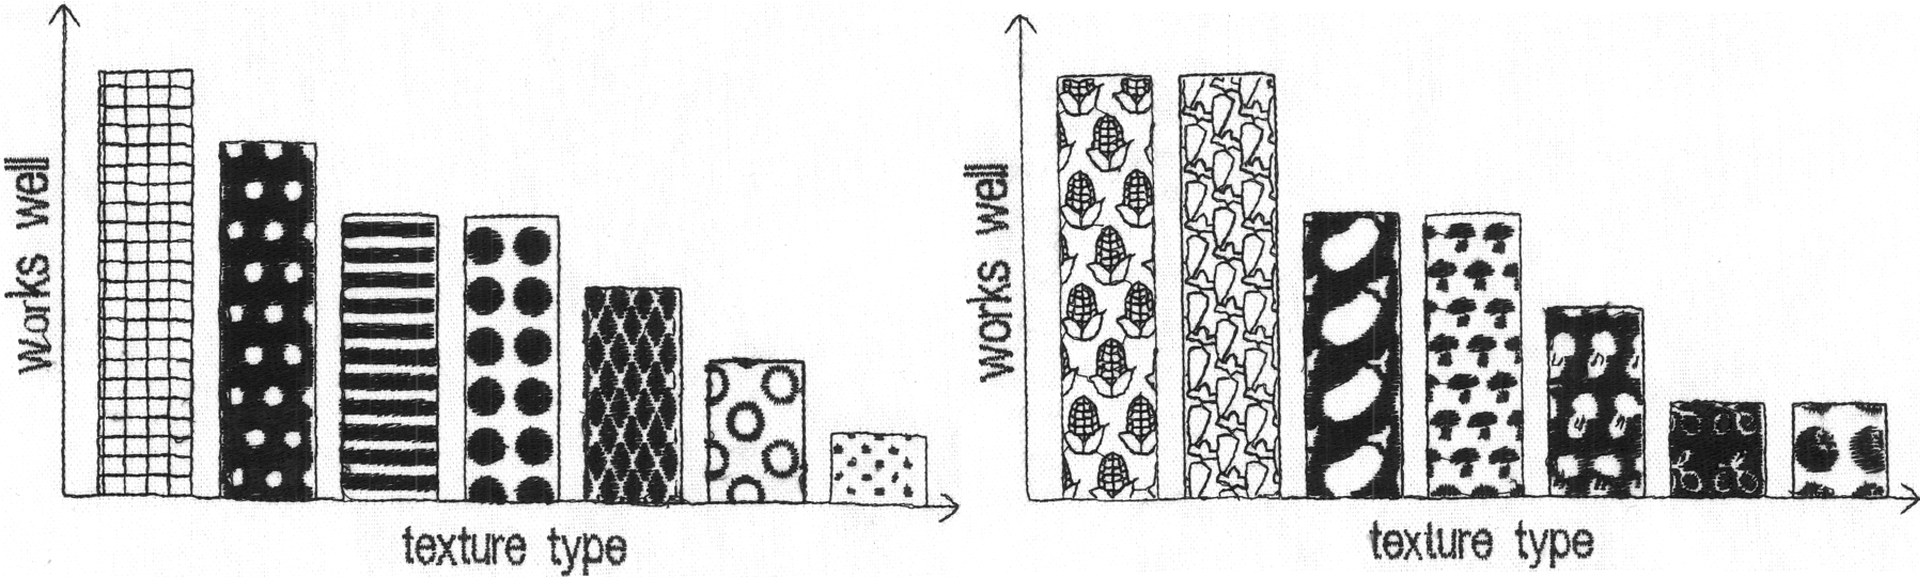
We then had 150 participants rate these designs for aesthetics.
Finally, with the top-rated geometric and iconic textures, our perceptual assessment experiment with 150 participants revealed that textured charts perform about equally well as non-textured charts, and that there are some differences depending on the type of chart.
. Geometric textures use patterns of repeated abstract geometric shapes, while iconic textures use repeated icons that may stand for data categories.
We parameterized both types of textures and developed a tool for designers to create textures on simple charts by adjusting texture parameters. 30 visualization experts used our tool and designed 66 textured bar charts, pie charts, and maps.
We then had 150 participants rate these designs for aesthetics.
Finally, with the top-rated geometric and iconic textures, our perceptual assessment experiment with 150 participants revealed that textured charts perform about equally well as non-textured charts, and that there are some differences depending on the type of chart.
Publications
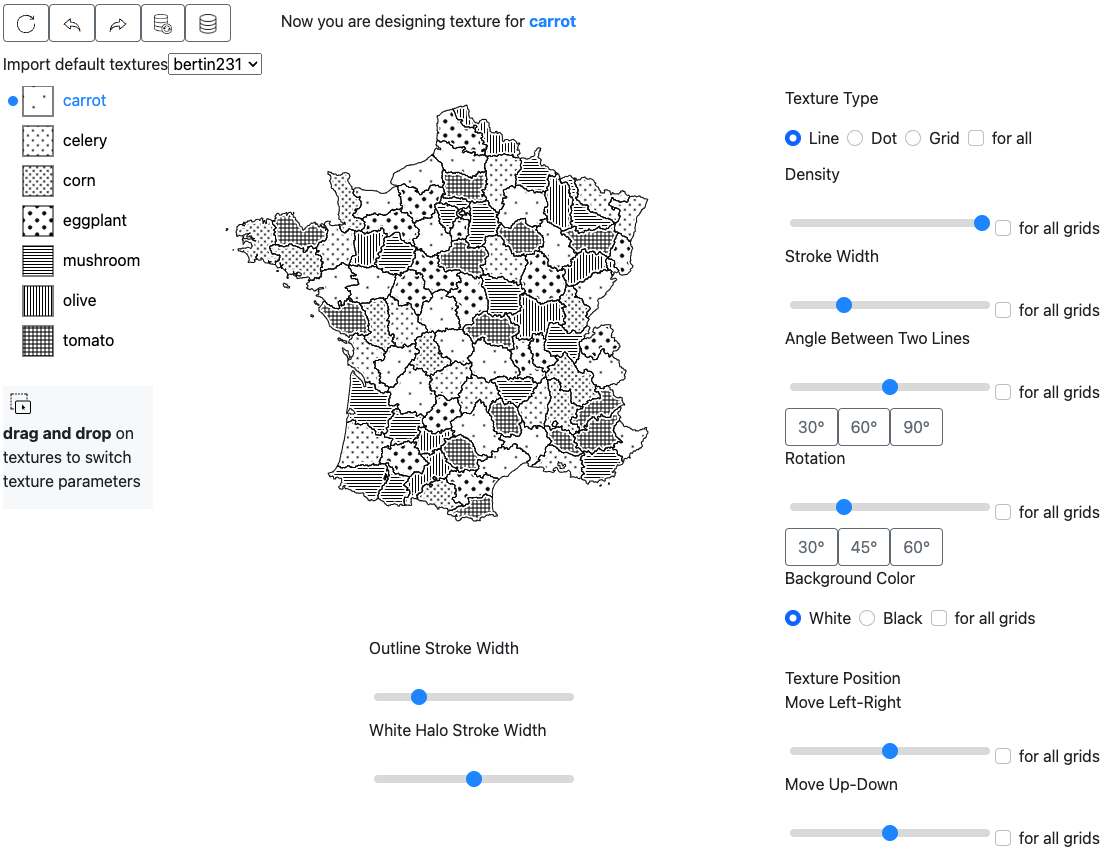
Try our texture design interface
To gather texture designs from experts, we developed a web-based technology probe. This tool enables users to craft chart designs using black-and-white textures by adjusting various parameters. You can try it out here:
Texture designs collected from experts
With our texture design interface, we collected 66 designs from 30 experts. These designs included 14 bar charts, 30 pie charts, and 22 maps. You can find all the designs in here.
Pictures
The images in the paper are available in the OSF repository of each paper under a  CC-BY 4.0 license. See the license statement at the end of each paper.